Cities are now home to the majority of the world’s population, and are drivers of economic growth, wealth creation, social interaction and well-being. They also present huge inequalities in health, affluence, education and lifestyle with persistent challenges for management, administration and policy. For example, alongside an existing global market of £400 billion for smart city technology, the UN estimates that $350 trillion or five times global GDP needs to be spent on urban infrastructure to address urgent needs.
The Urban Analytics programme at the Turing is focused on the process, structure, interactions and evolution of agents, technology and infrastructure within and between cities across spatial and temporal scales. Our work is focused on the following areas:

Digital Twins
How do we use new data and algorithms to simulate aspects of the urban environment and evaluate urban polices?
Land Use
How do we use new forms of data and AI to predict and optimize land use planning for buildings, cities and landscapes?

Urban Mobility
How do we promote equity and efficiency in all forms of urban mobility? How do we help local and national governments improve public infrastructure?

Liveability
How do we promote health, sustainability and prosperity for city populations?
The Urban Analytics Technology Platform is a collection of tools built at The Alan Turing Institute to solve common problems in the Urban Analytics space. Their are two tiers of projects which are detailed in the following sections. All of our tools are open source and we welcome collaboration.
Tier 1 Projects
High-level applications driven by collaborations with partners and the theme priorities
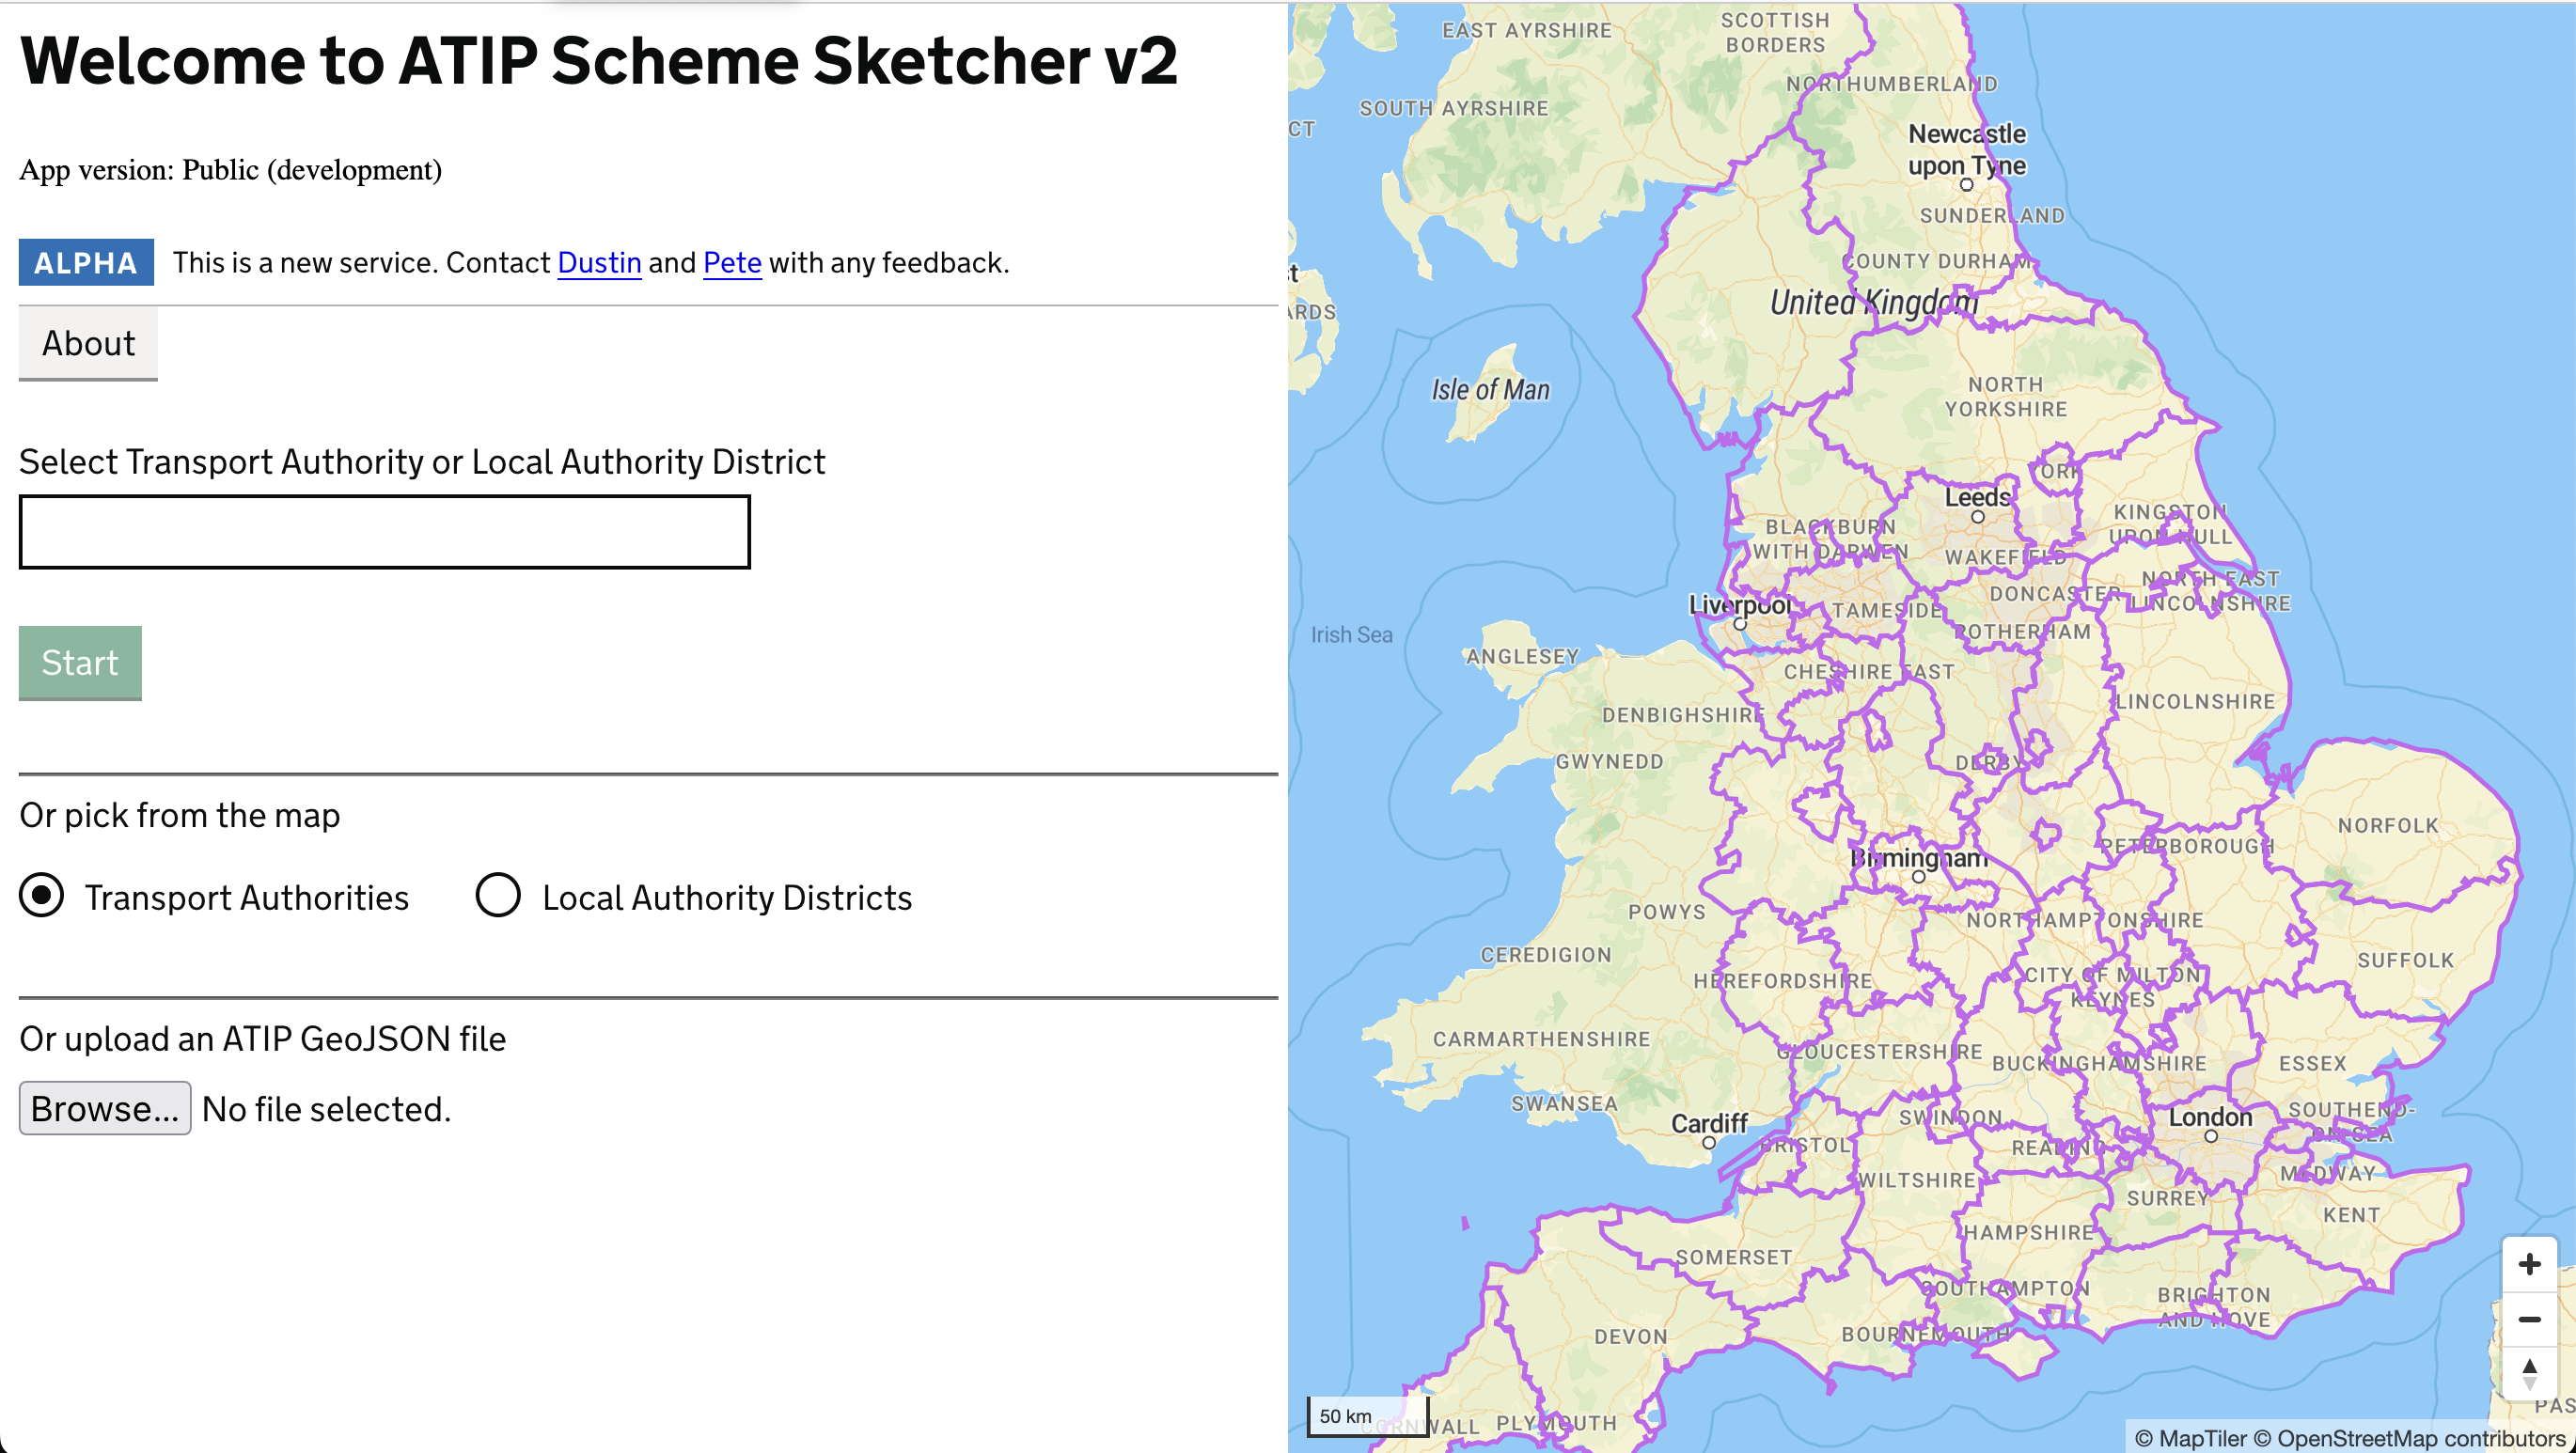
ATIP
An online tool to design, modify and share active travel infrastructure plans as part of ATE's offering
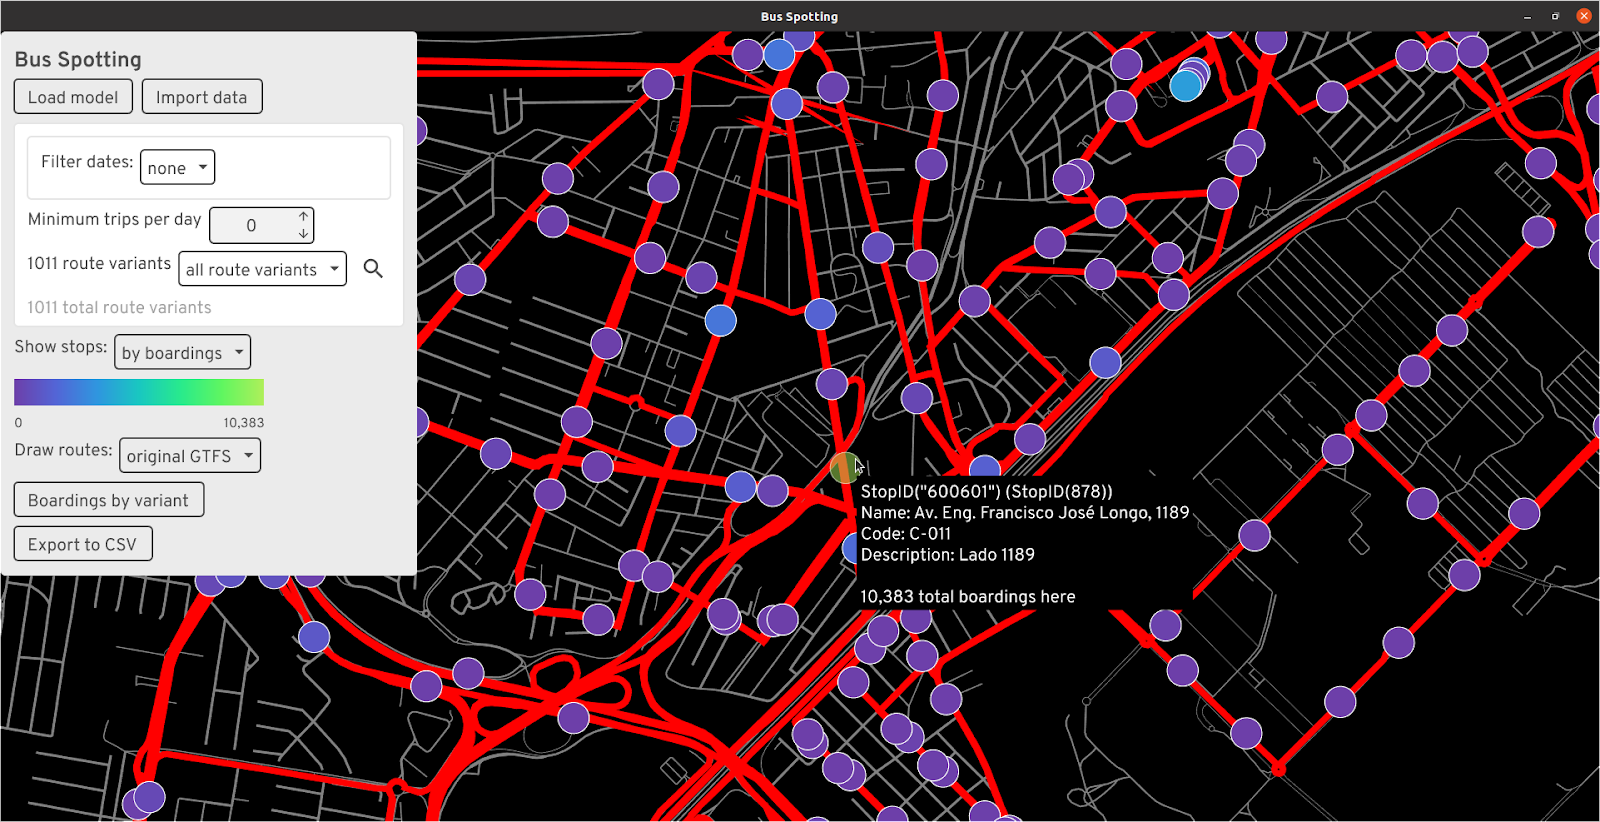
Bus Spotting
View GTFS public transit data and compare real-time bus data to idealized schedules
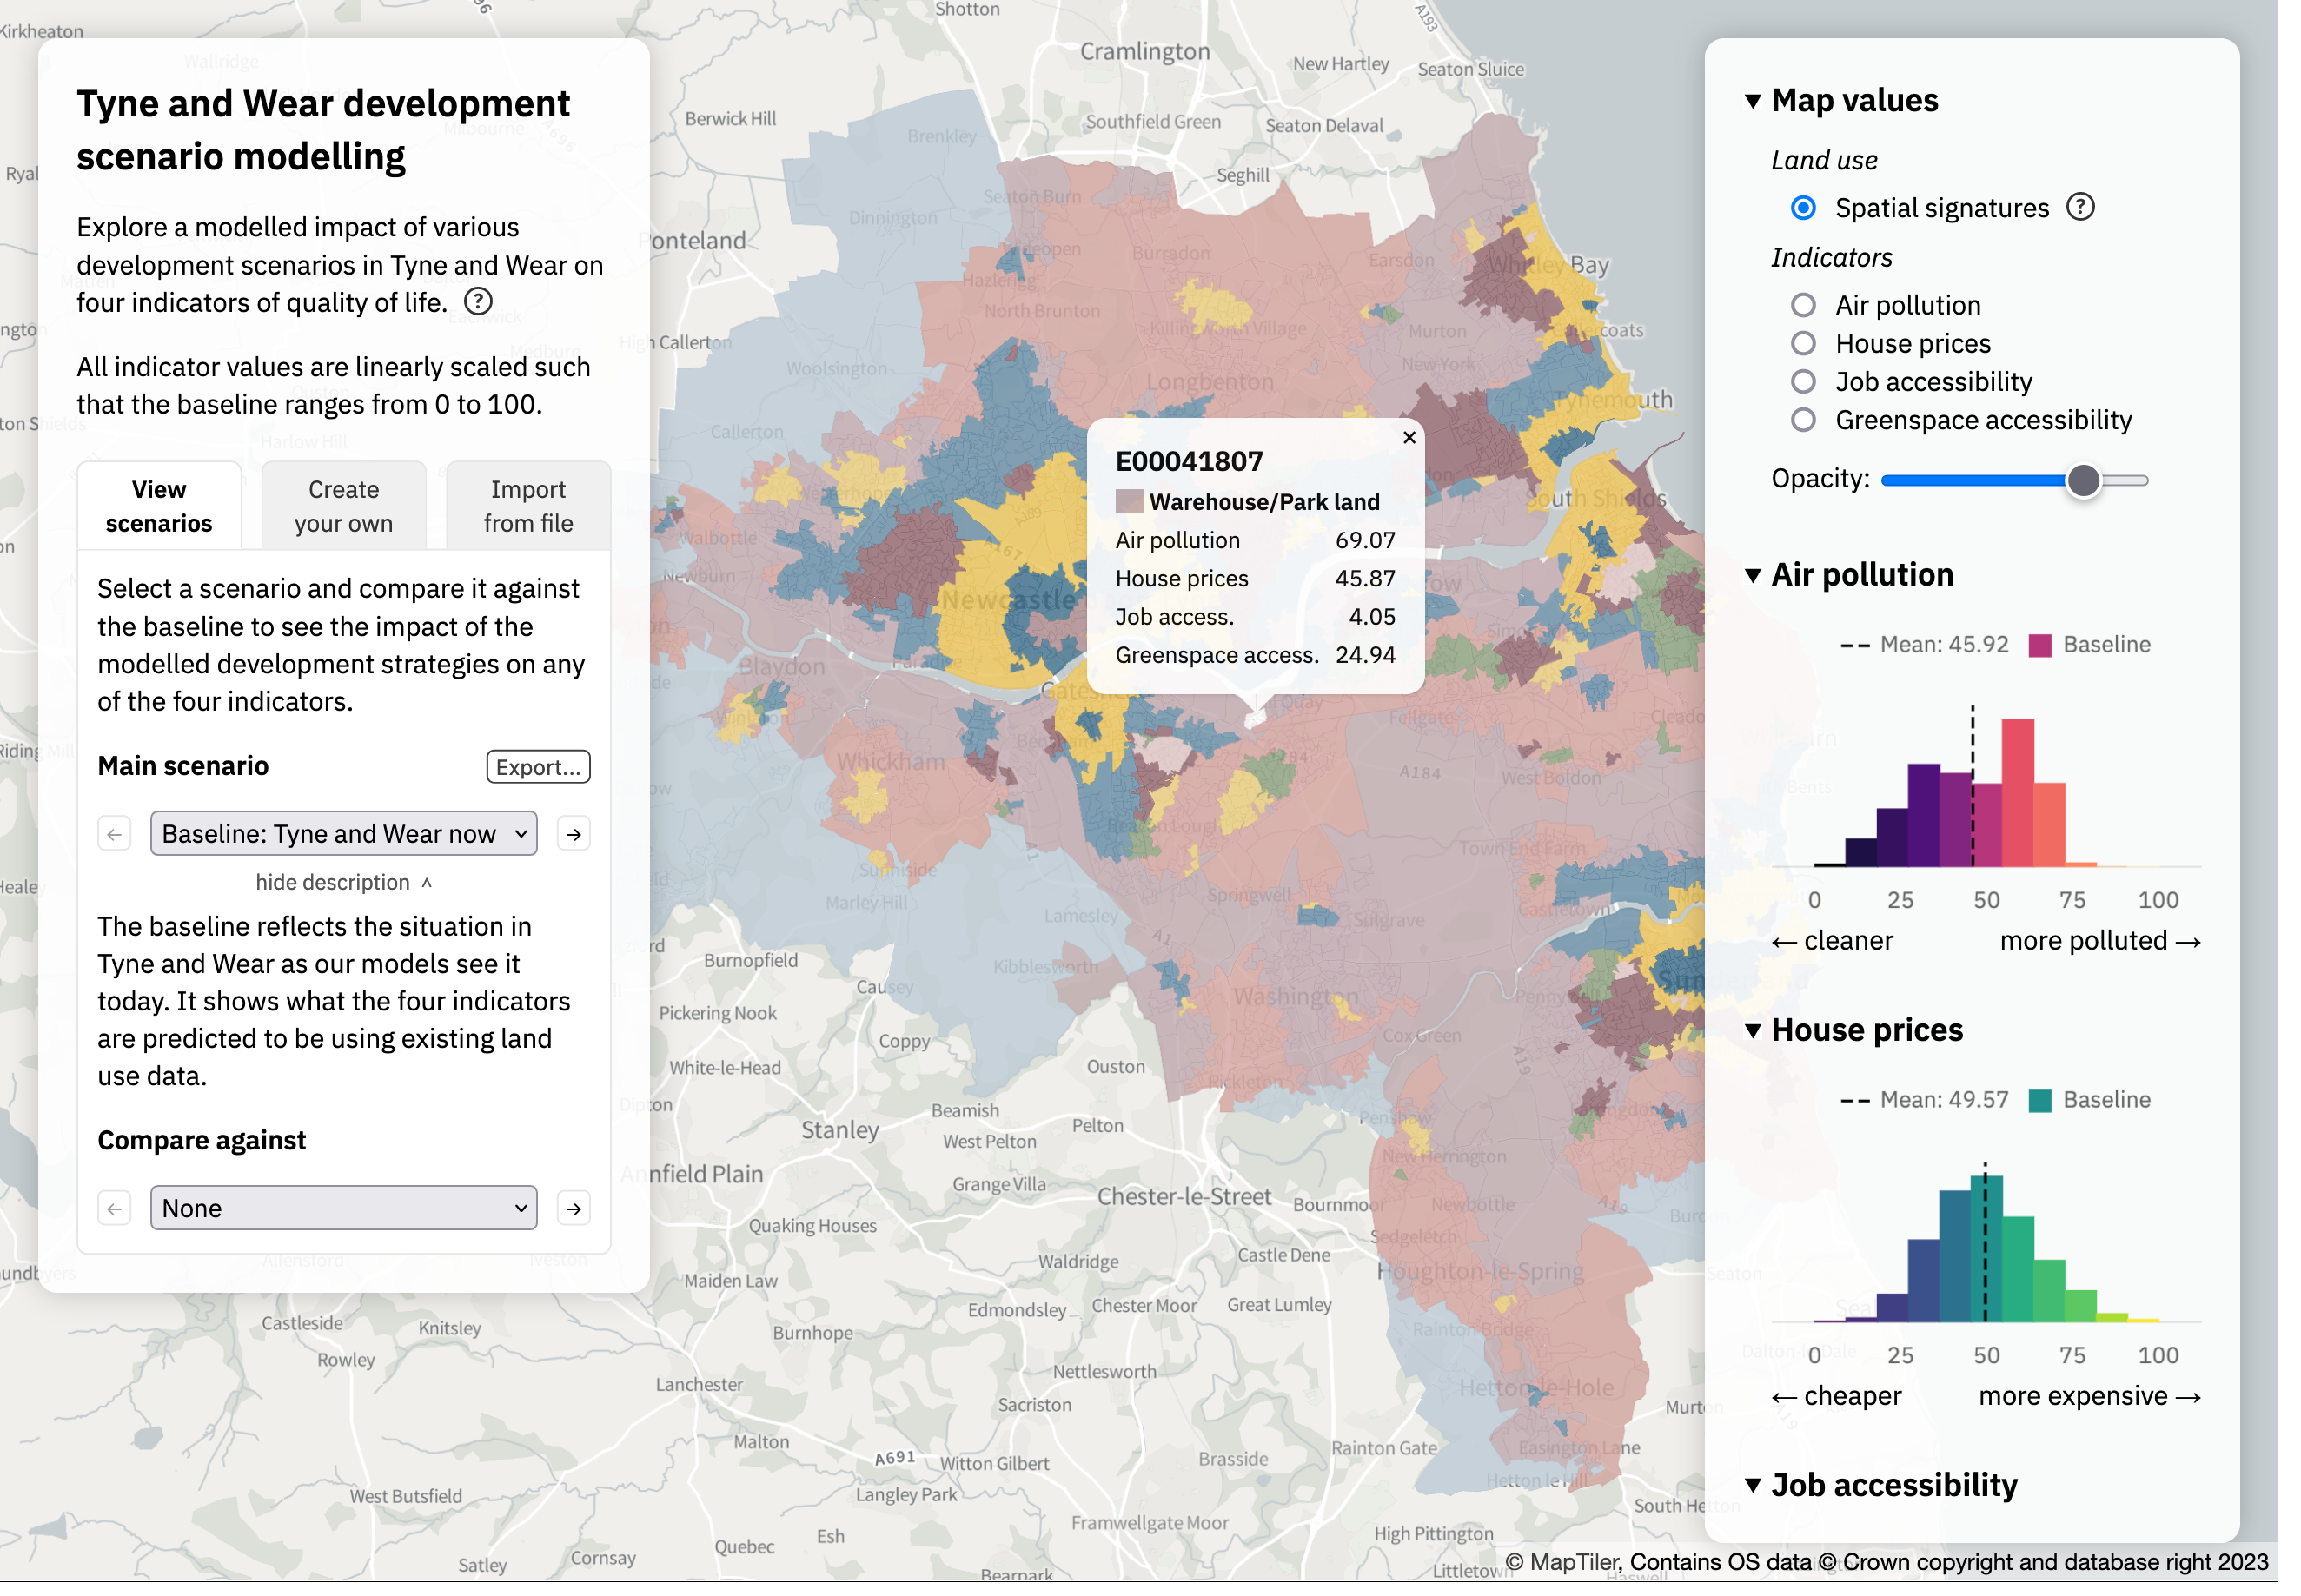
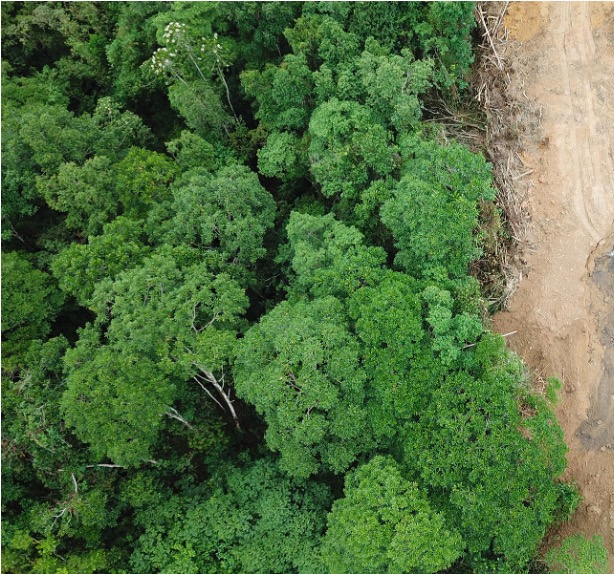
DemoLand
Spatial modelling for land management predicting the impact of large-scale planning and land use changes on the quality of life.

DyME - Climate, Heat and Health (DyME-CHH)
Use disaggregated climate data to model the health effects of heat exposure in different population groups, based on where they live and how they move
Low Traffic Neighbourhoods tool (LTN)
A software tool and web app to study and communicate about design and impact of LTNs. Dev

odjitter
Disaggregate zone-based origin/destination data to specific points for building travel-demand models
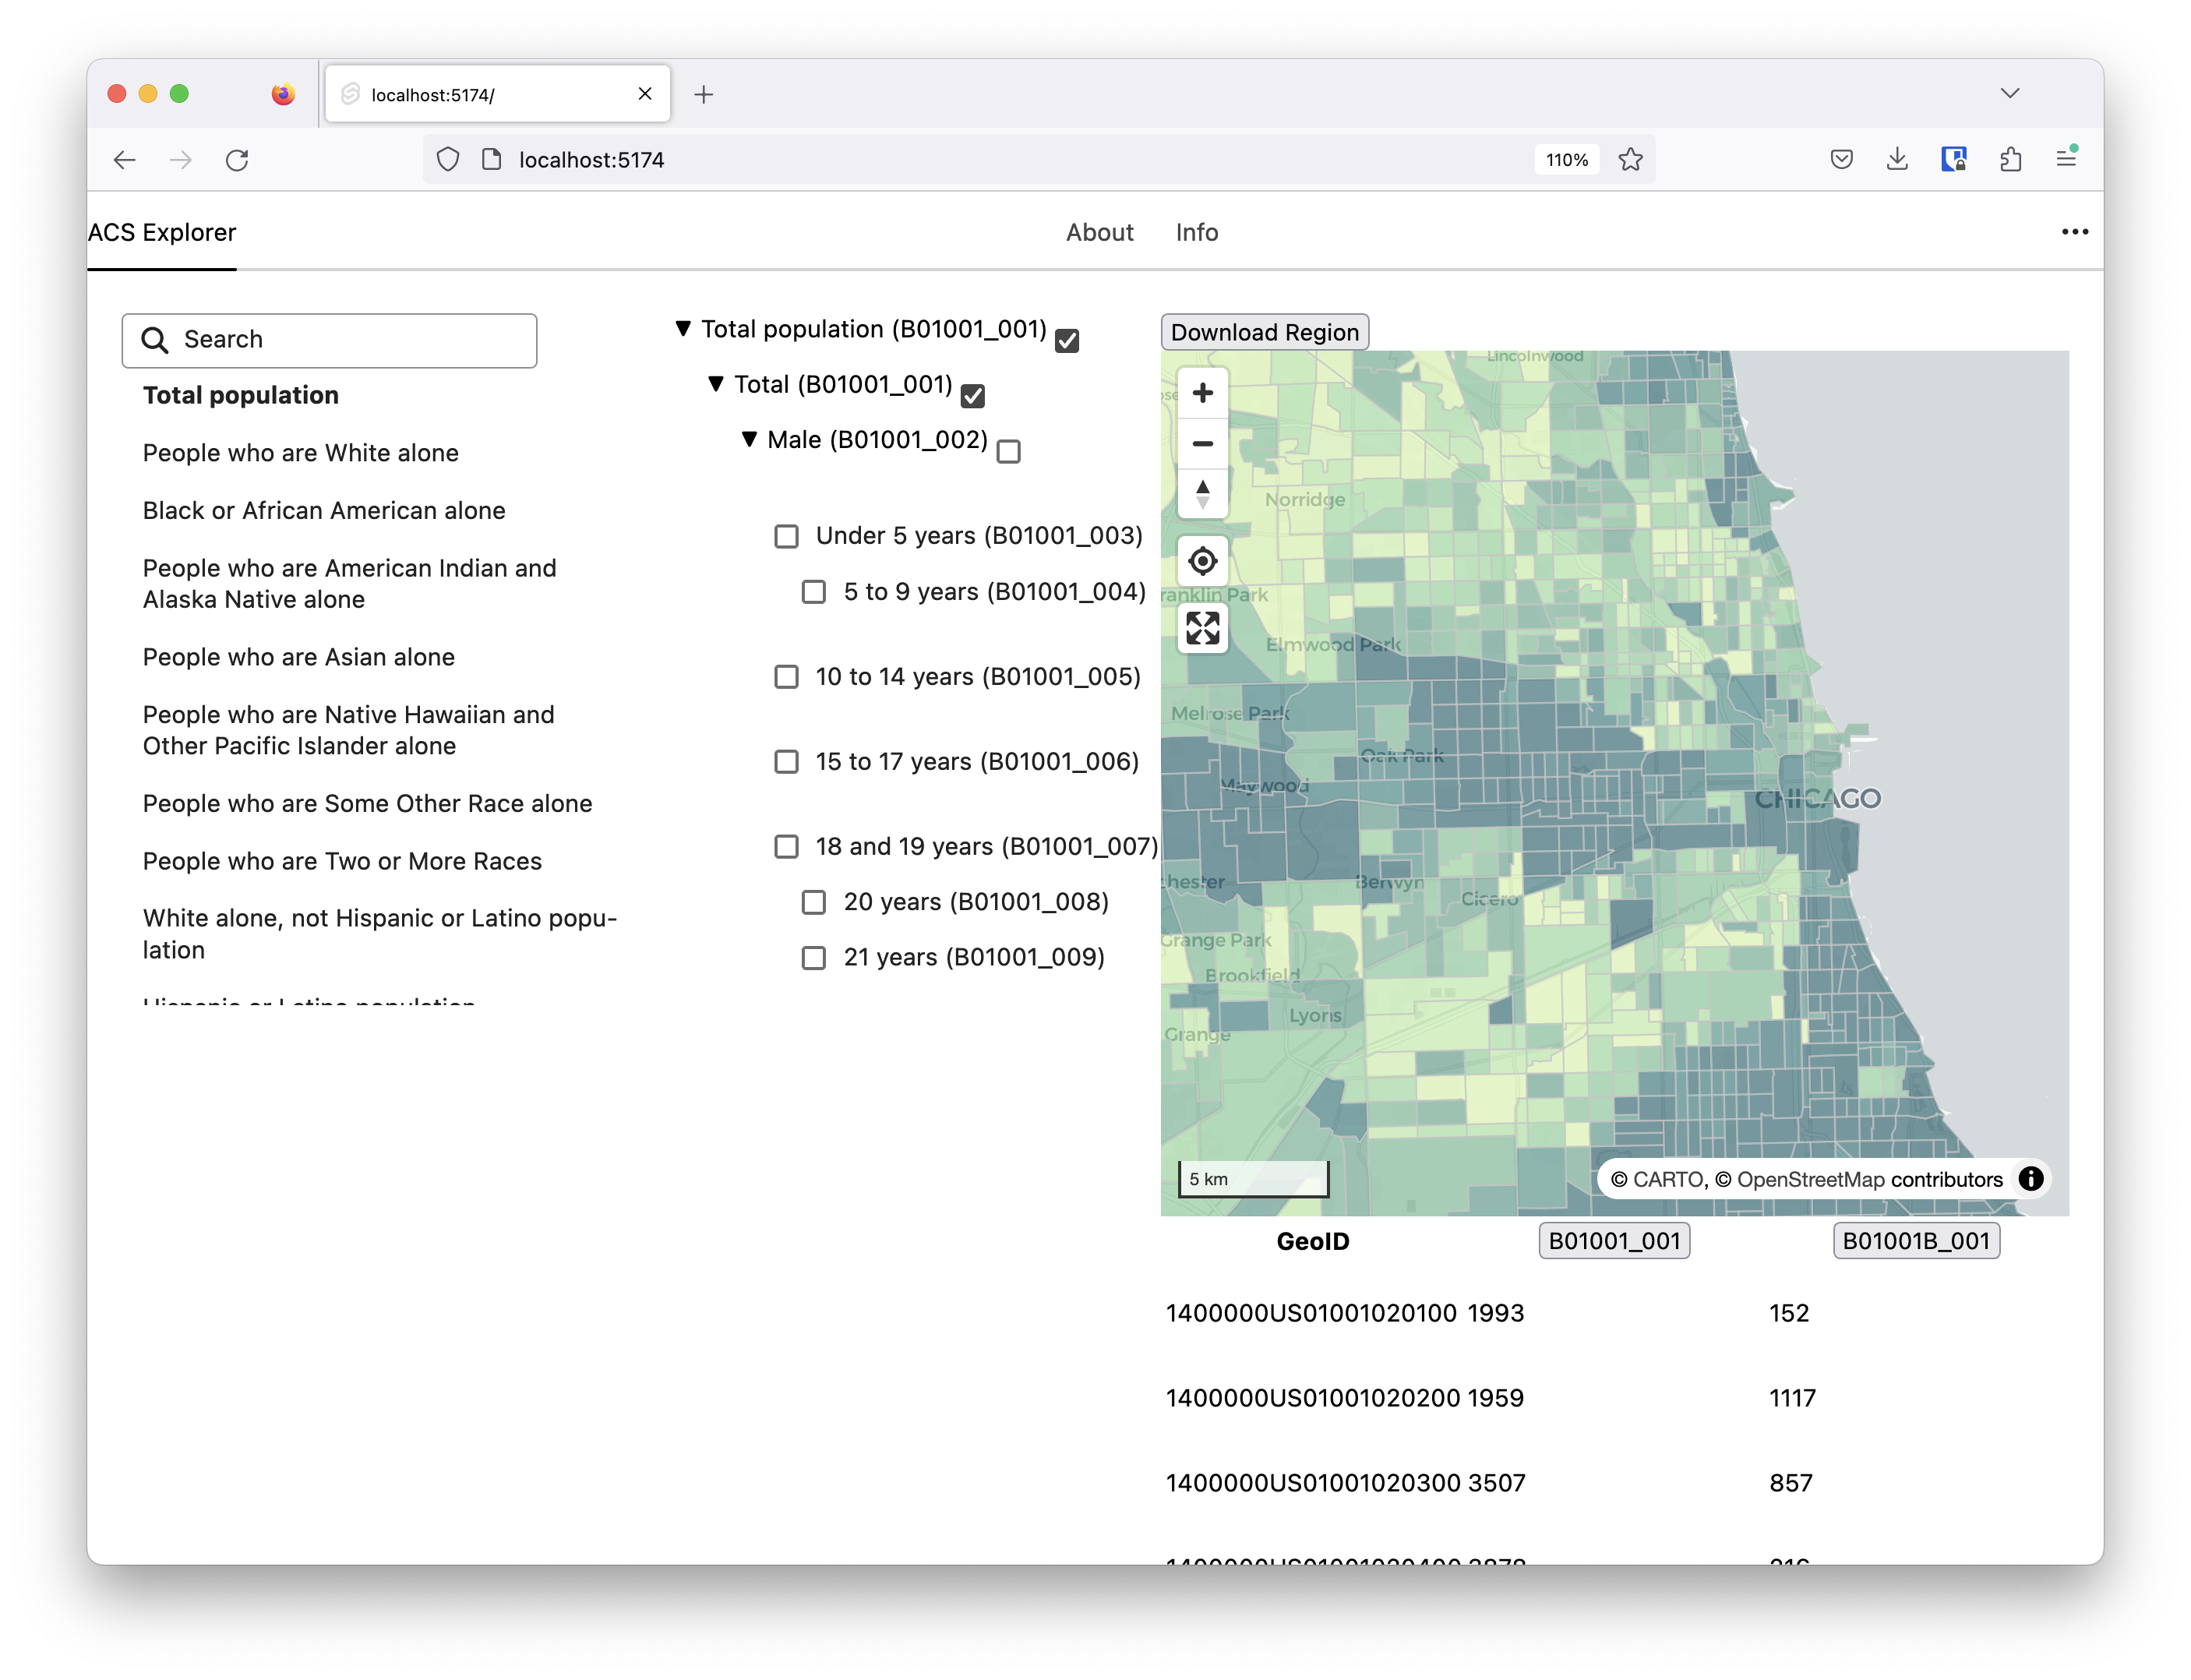
Popgetter
Get all the census you need or want using popgetter
Project Management & Community Engagement
Oversight of all projects, from planning and organisation to community engagement, execution and completion.
Tier 2 Projects
Low-level packages and data that can be reused in many contexts

Agent-based Simulation of ePIdemics at Country Scale (ASPICS)
SEIR model meant to work with SPC that models a pandemic in Great Britain
Clim Recal
Collection of methods to de-bias climate projection data (sub-component of DyME-CHH but also used as independent codebase)

Colouring Cities/Colouring London
Colouring Cities/Colouring London
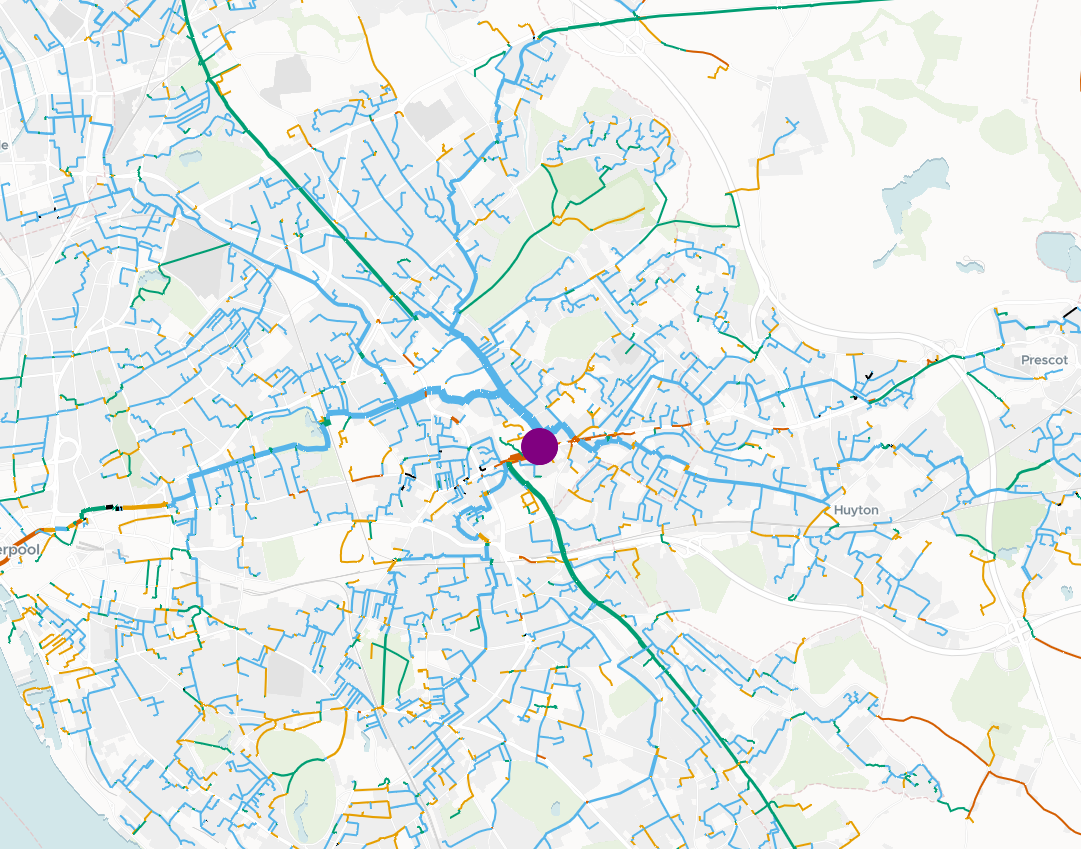
od2net
Tool to rapidly generate route networks in different formats
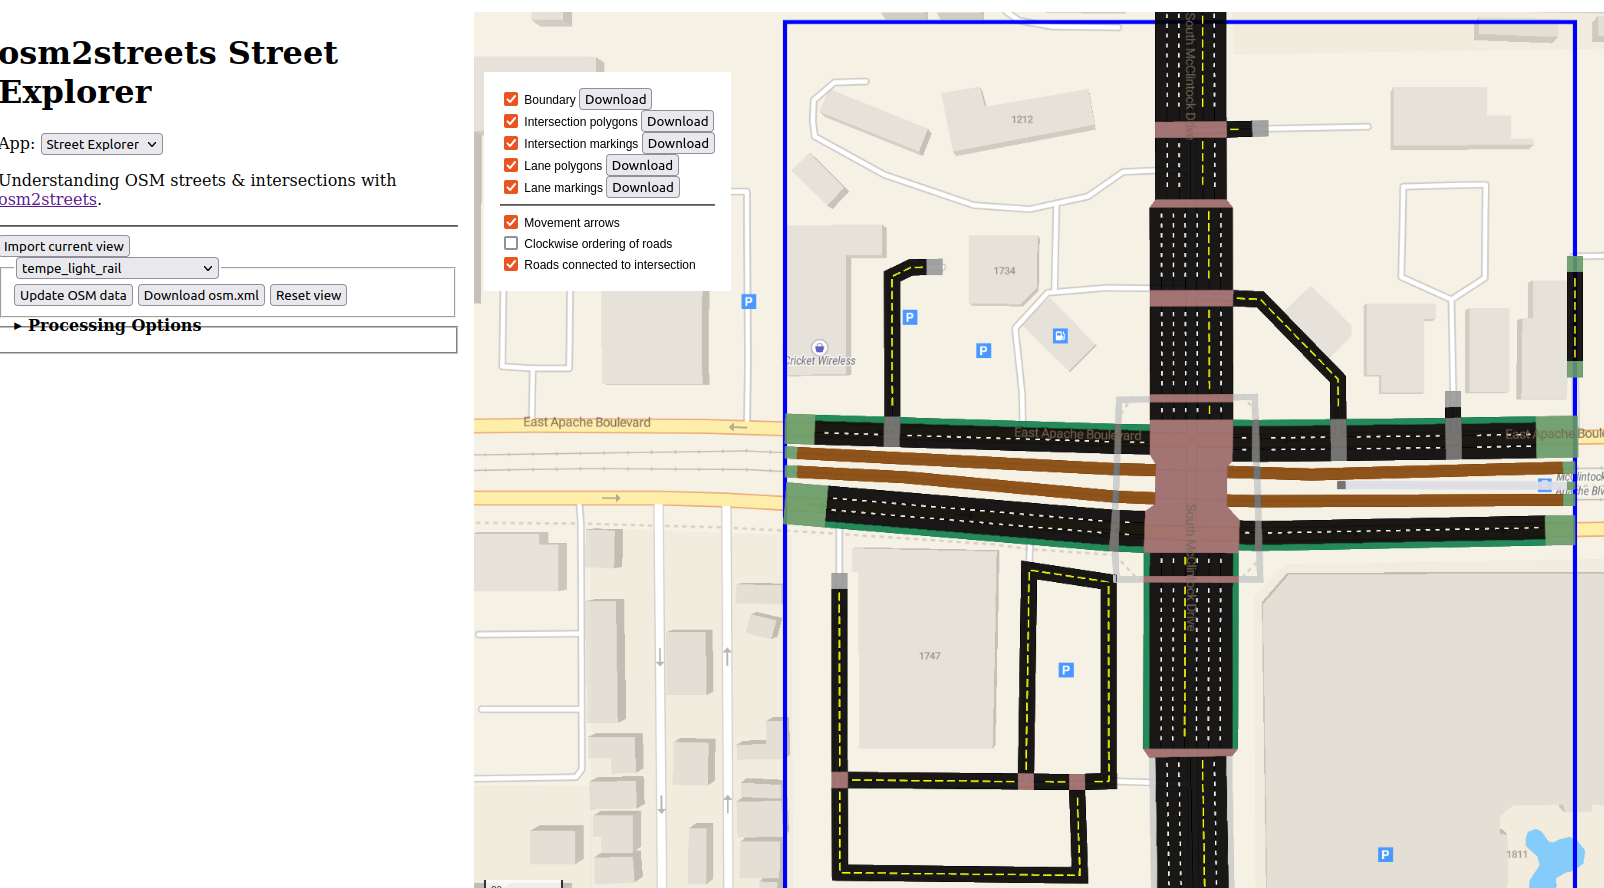
osm2streets
Transform OpenStreetMap data to street networks with detailed geometry and semantics

Route Snapper
Draw routes in MapLibre snapped to a street network using client-side routing
Synthetic Population Catalyst
Tool that creates a synthetic population for any area within Great Britain, including socio-demographic, health and daily activity data. Calibrated to 2020, with projections of some variables to between 2012 and 2039.
Urban Grammar (Signatures)
This project uses satellite imagery, Ordnance Survey data and ML models to characterise urban area use into a number of distinct categories